Project overview
This report is a sample deliverable built on public data to show how HST GENOMICS delivers a bulk RNA-seq differential expression project. Data: GEO series GSE147507 (Blanco-Melo et al., 2020), Series 1: primary human bronchial epithelial cells (NHBE), SARS-CoV-2 infected versus mock, three replicates each, raw count matrix as deposited.
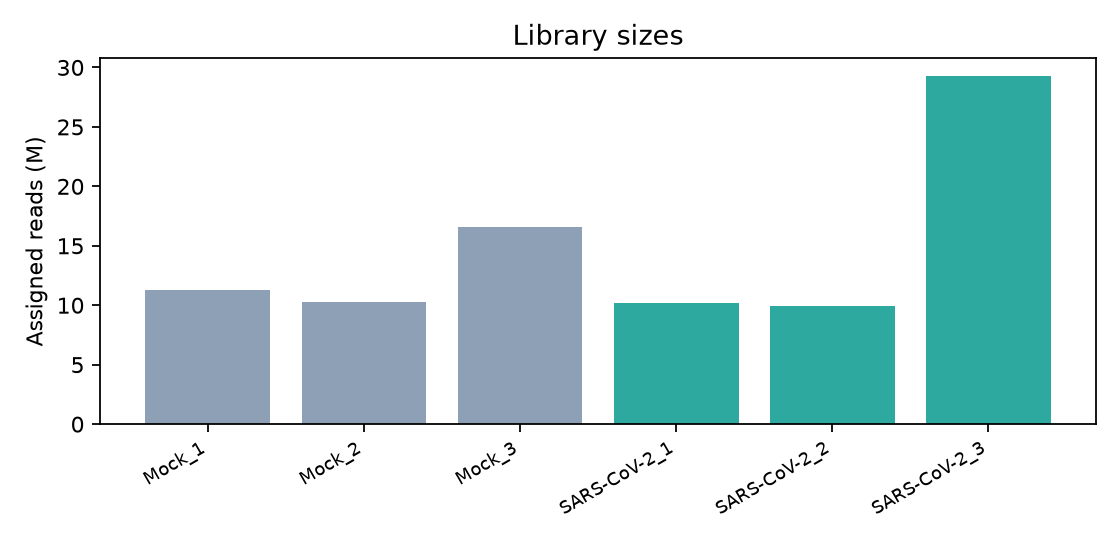
| Sample | Group | Assigned reads |
|---|---|---|
| Series1_NHBE_Mock_1 | mock | 11.3 M |
| Series1_NHBE_Mock_2 | mock | 10.3 M |
| Series1_NHBE_Mock_3 | mock | 16.6 M |
| Series1_NHBE_SARS-CoV-2_1 | infected | 10.2 M |
| Series1_NHBE_SARS-CoV-2_2 | infected | 9.9 M |
| Series1_NHBE_SARS-CoV-2_3 | infected | 29.3 M |
Methods
- Input: gene-level raw counts as deposited by the authors (STAR alignment, featureCounts); reads were not re-aligned for this demo.
- Filtering: genes with fewer than 10 counts across the six samples removed; 14,159 of 21,797 genes retained, of which 13,061 passed DESeq2 independent filtering and received adjusted P values.
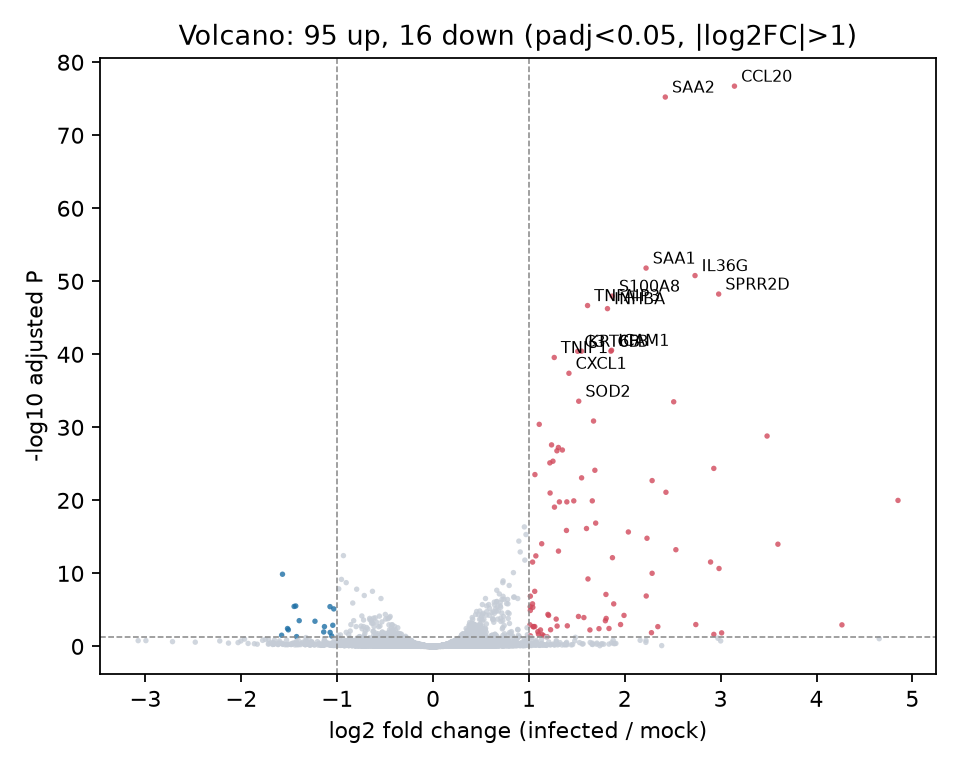
- Differential expression: PyDESeq2 0.5.4 (Python implementation of the DESeq2 method), design ~condition, contrast infected vs mock, Wald test, Benjamini–Hochberg adjustment; significance padj < 0.05 and |log2FC| > 1.
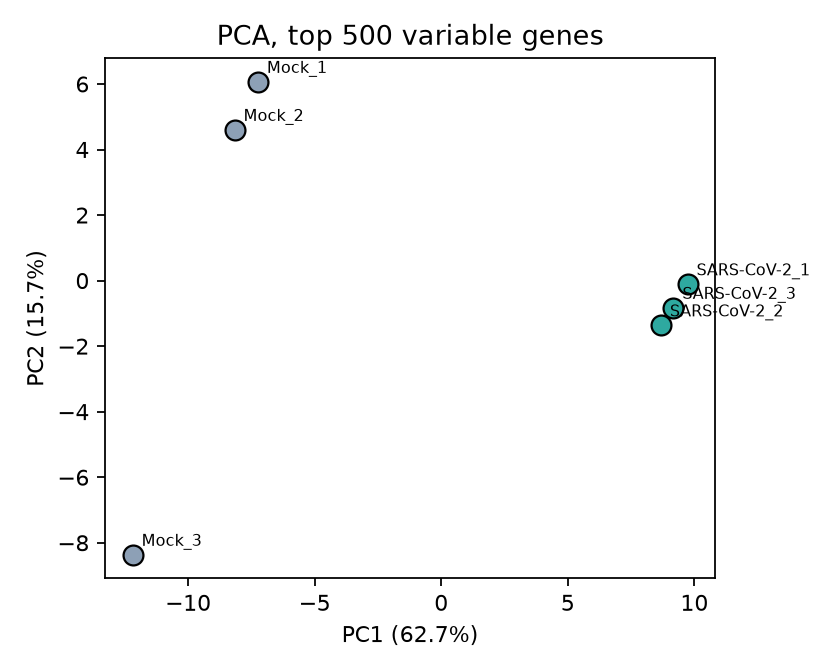
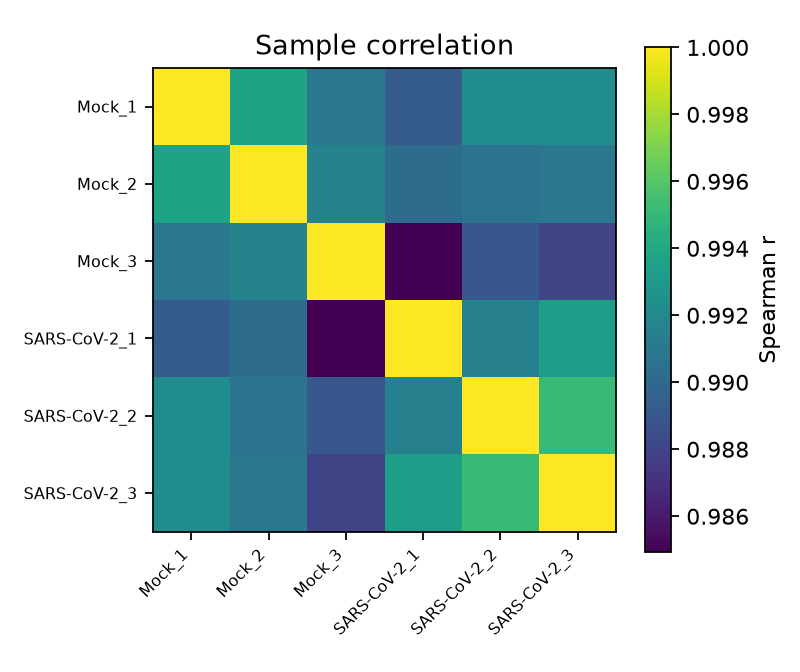
- QC: library sizes, PCA on the 500 most variable genes (log2 CPM), Spearman correlation between samples.
- Enrichment: over-representation analysis of up-regulated genes against MSigDB Hallmark gene sets (Enrichr via gseapy 1.3.1).
Quality control
Results
At padj < 0.05 and |log2FC| > 1, 111 genes are differentially expressed: 95 up and 16 down in infected cells.
| Gene | baseMean | log2FC | padj |
|---|---|---|---|
| CCL20 | 412.1 | 3.14 | 1.87e-77 |
| SAA2 | 575.8 | 2.42 | 5.82e-76 |
| SAA1 | 3316.1 | 2.22 | 1.54e-52 |
| IL36G | 271.3 | 2.73 | 1.65e-51 |
| SPRR2D | 365.2 | 2.98 | 5.60e-49 |
| S100A8 | 1707.1 | 1.87 | 1.07e-48 |
| TNFAIP3 | 2288.8 | 1.61 | 2.09e-47 |
| INHBA | 1216.9 | 1.82 | 5.53e-47 |
| ICAM1 | 1884.7 | 1.86 | 2.81e-41 |
| KRT6B | 2803.4 | 1.55 | 3.71e-41 |
| CFB | 789.3 | 1.85 | 3.71e-41 |
| C3 | 6336.0 | 1.51 | 3.85e-41 |
| TNIP1 | 4659.3 | 1.26 | 2.71e-40 |
| CXCL1 | 1801.7 | 1.42 | 3.96e-38 |
| SOD2 | 2001.4 | 1.52 | 2.65e-34 |
| MX1 | 427.7 | 2.51 | 3.19e-34 |
| ZC3H12A | 870.7 | 1.67 | 1.37e-31 |
| S100A9 | 12313.2 | 1.11 | 3.89e-31 |
| CXCL5 | 104.7 | 3.48 | 1.56e-29 |
| C15orf48 | 897.0 | 1.24 | 2.54e-28 |
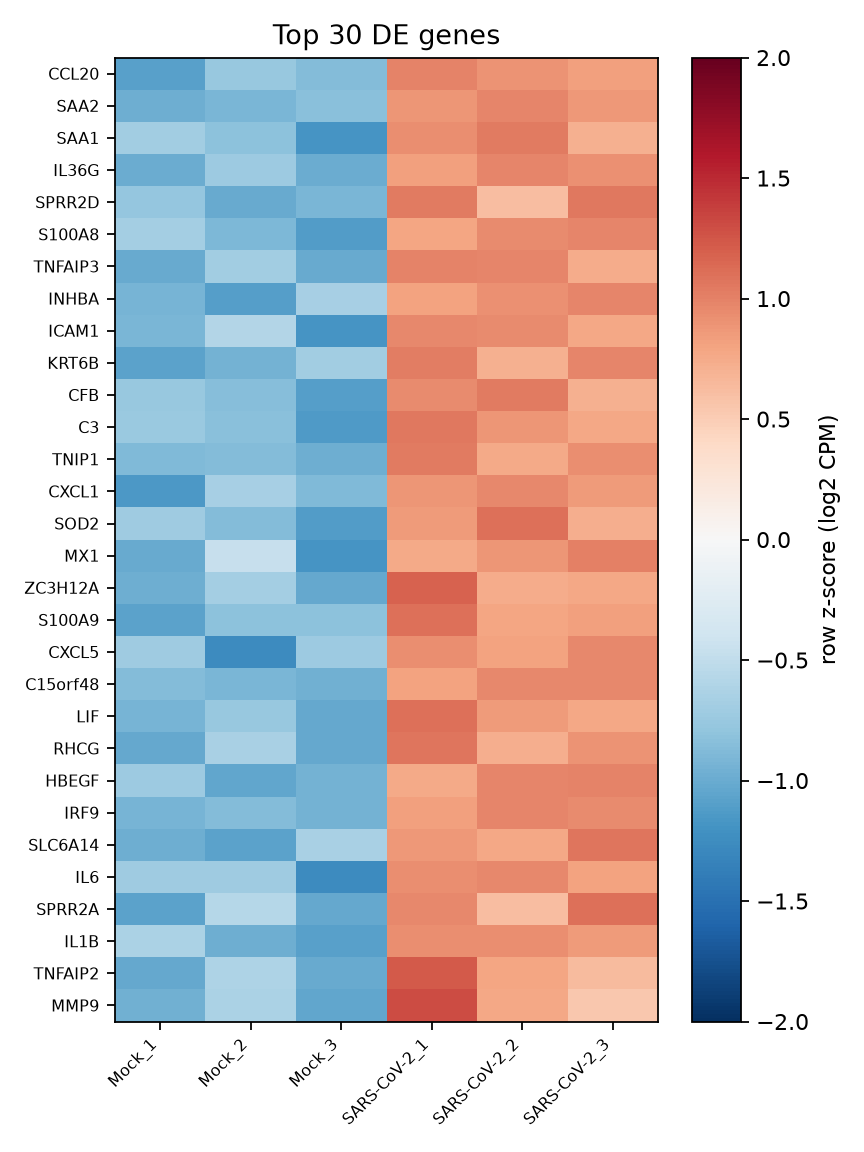
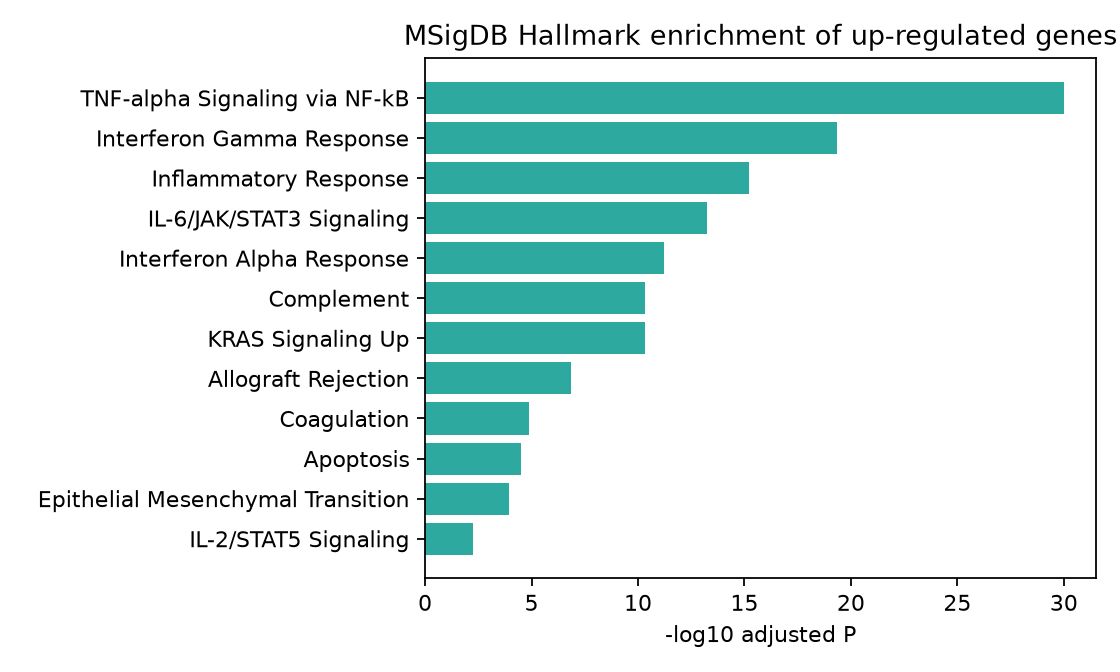
Comparison with the original study: only 1 of the top 20 up-regulated genes (MX1) is a classical interferon-stimulated gene; the list is dominated by chemokines and inflammatory genes (CCL20, CXCL1, CXCL5, IL36G), Hallmark interferon-gamma and interferon-alpha response sets are nevertheless significantly enriched among up-regulated genes (Table 3): interferon-stimulated genes are induced, but less prominently than chemokines. This agrees with the original study (Blanco-Melo et al., 2020), which reported a comparatively muted interferon response with strong chemokine induction.
| Term | Overlap | Adjusted P |
|---|---|---|
| TNF-alpha Signaling via NF-kB | 27/200 | 9.77e-31 |
| Interferon Gamma Response | 20/200 | 4.74e-20 |
| Inflammatory Response | 17/200 | 6.07e-16 |
| IL-6/JAK/STAT3 Signaling | 12/87 | 5.97e-14 |
| Interferon Alpha Response | 11/97 | 6.10e-12 |
| Complement | 13/200 | 4.60e-11 |
| KRAS Signaling Up | 13/200 | 4.60e-11 |
| Allograft Rejection | 10/200 | 1.35e-07 |
| Coagulation | 7/138 | 1.33e-05 |
| Apoptosis | 7/161 | 3.28e-05 |
| Epithelial Mesenchymal Transition | 7/200 | 1.20e-04 |
| IL-2/STAT5 Signaling | 5/199 | 5.73e-03 |
Deliverables
- tables/DE_results_all_genes.csv: DESeq2 results for all tested genes
- tables/DE_significant_padj0.05_log2FC1.csv: significant genes
- tables/enrichment_hallmark_upregulated.csv: enrichment results
- tables/counts_raw_selected_samples.csv, tables/sample_sheet.csv: input counts and sample sheet
- figures/*.png: publication figures (PDF/SVG on request)
- run_bulk.py, report_lib.py, requirements.txt, README.txt: complete re-runnable code, parameters and instructions
Methods paragraph (for the manuscript)
Gene-level raw counts were obtained from GEO (GSE147507). Genes with fewer than 10 counts across the six samples were removed. Differential expression between infected and mock samples was tested with PyDESeq2 0.5.4 (design ~condition, Wald test) with Benjamini–Hochberg correction; genes with adjusted P < 0.05 and |log2 fold change| > 1 were called differentially expressed. Up-regulated genes were tested for over-representation in MSigDB Hallmark gene sets with Enrichr.