
For tissue, cell line, blood and other routine samples: two-group or multi-group comparisons, time series, treatment versus control. The comparison design is written into the analysis plan before any work starts.
| You provide | You receive |
|---|---|
| fastq files (or an existing expression matrix) | QC report and alignment/quantification statistics |
| Sample sheet: groups, batches, replicates | Normalised expression matrix and differential gene tables (Excel/CSV) |
| Species and reference genome version (we can advise) | Publication-ready figures: PCA, volcano, heatmap, enrichment (PDF/SVG/PNG) |
| The question you want answered and the target journal (optional) | Analysis code and parameters, plus a methods paragraph |
Typical turnaround: 5–10 working days for the standard scope; complex designs as stated in the written analysis plan. Quotes are per project, returned within 1 working day.
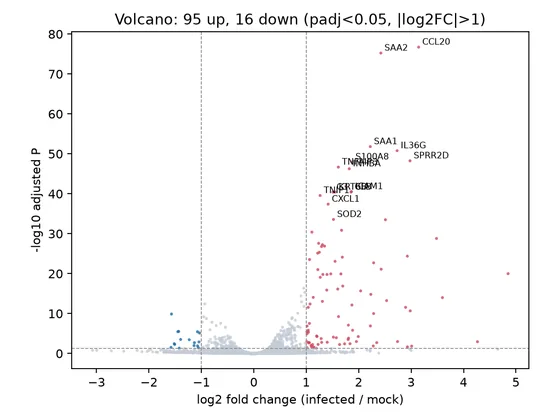
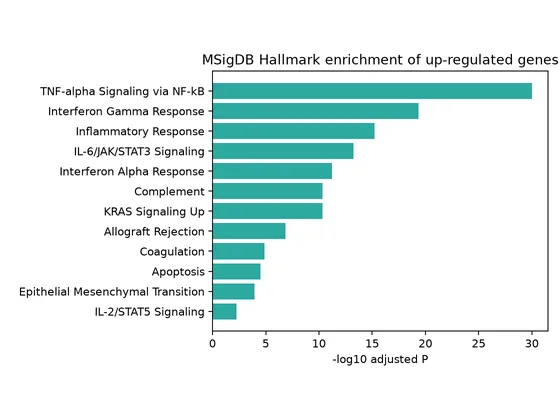
We can run it, but statistical power is limited; the report states the limitation and suggests validation. Three or more biological replicates per group is the usual requirement and we say so at the plan stage.
Yes. Send the matrix and the sample sheet; we first check whether it holds counts or TPM/FPKM and choose the method accordingly.
By default the current Ensembl or NCBI release, matched to any data you already have. The version is stated in the plan and in the report.
For 10x Genomics, BD Rhapsody and other droplet- or microwell-based platforms, and for published public datasets. We start from fastq or Cell Ranger output, and also accept Seurat / AnnData objects.
| You provide | You receive |
|---|---|
| fastq or Cell Ranger output (filtered matrix) | QC report with every threshold and its rationale |
| Sample sheet: groups, batches, tissue | Annotated object (Seurat .rds or .h5ad) |
| The cell types or questions you care about | Publication-ready figures: UMAP, marker dot plots, proportion bars, heatmaps |
| Published reference annotations (optional) | Differential gene and enrichment tables per cell type, code and methods paragraph |
Typical turnaround: 10–15 working days for the standard scope; complex designs as stated in the written analysis plan. Quotes are per project, returned within 1 working day.
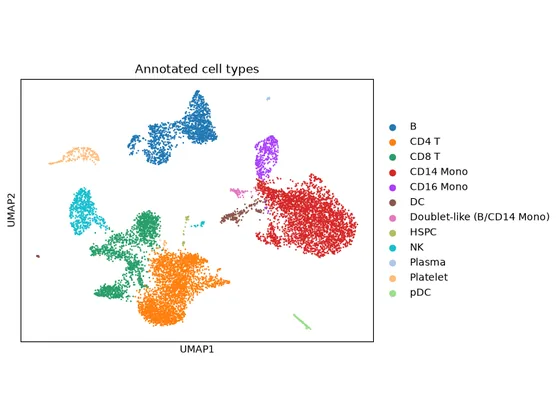
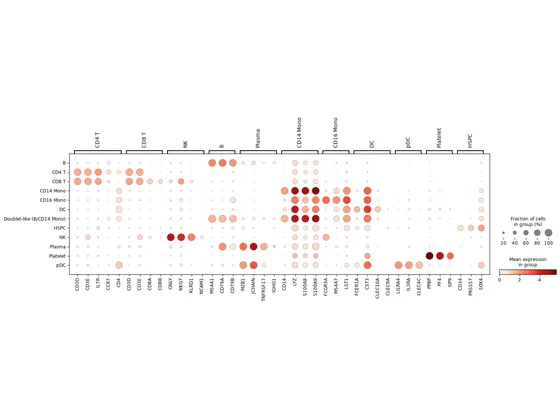
We can produce results, but cell-level tests overstate significance. Where sample numbers allow we aggregate to sample level (pseudobulk); otherwise the report states the limitation.
Reference-based labels are checked against canonical markers. Clusters that markers do not support keep their number rather than a name, and the evidence is listed in the report.
After integration we check that the treatment-versus-control differences are still present and show before/after comparisons in the report.
For 10x Visium, Visium HD, Xenium, MERFISH and other spatial platforms. We start from Space Ranger or platform output and return results registered to the tissue image.
| You provide | You receive |
|---|---|
| Space Ranger or platform output including the tissue image | QC report and spatial domain results |
| Section sheet: groups, tissue type, pathology annotation if any | Publication-ready overlays on the tissue image (PDF/SVG/PNG) |
| Matched single-cell reference (optional, for deconvolution) | SVG and regional differential tables |
Typical turnaround: 10–15 working days for the standard scope; complex designs as stated in the written analysis plan. Quotes are per project, returned within 1 working day.
No public example is available for this analysis yet. Deliverables follow the same structure as our sample reports (report, figures, tables, code, methods text); the specific figures are listed in the written plan.
Yes, using a public single-cell dataset from the same tissue as reference; the report states the source and its limits.
Yes. Send the annotated image or coordinates and we compare by region.
For strand-specific total RNA and small RNA sequencing. Beyond identification and quantification, the emphasis is on linking non-coding RNAs to target genes and pathways.
| You provide | You receive |
|---|---|
| Total RNA or small RNA fastq files | Identification and expression tables for each RNA class |
| Sample sheet and comparison design | Differential results with enrichment figures |
| Species and reference genome version | ceRNA network files (Cytoscape-ready) |
Typical turnaround: 7–12 working days for the standard scope; complex designs as stated in the written analysis plan. Quotes are per project, returned within 1 working day.
No public example is available for this analysis yet. Deliverables follow the same structure as our sample reports (report, figures, tables, code, methods text); the specific figures are listed in the written plan.
Tools use different criteria for back-splice junctions. We report the intersection of several tools as the high-confidence set and also provide each tool's full list.
We use the miRBase annotation of a close relative plus novel miRNA prediction, and state the basis in the report.
Tell us the data type and the question you want answered. You will receive a written analysis plan and quote within 1 working day.
Request an analysis plan